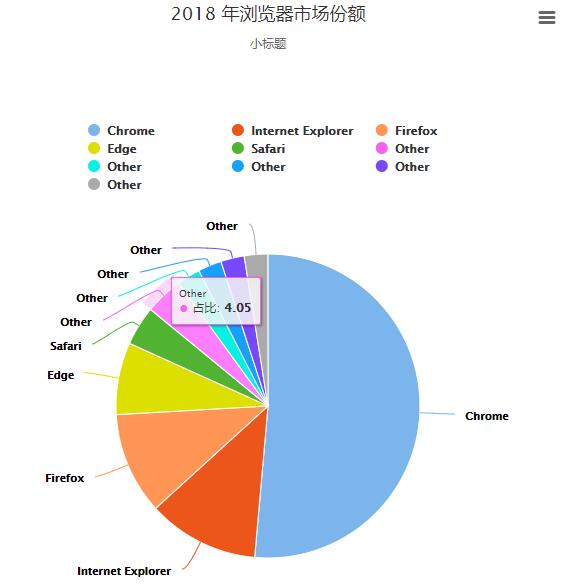
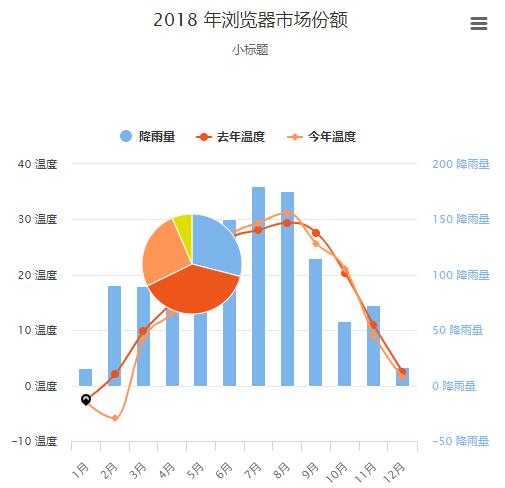
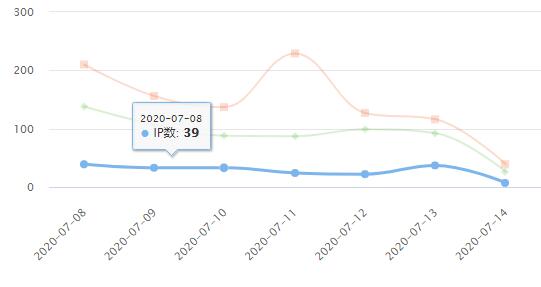
纯Javascript图表插件 Highcharts封装调用示例,折线图、饼图、柱状图、走势图等图表
Highcharts是一个制作图表的纯Javascript类库,兼容当今所有的浏览器,包括iPhone、IE和火狐等等; 对个人用户完全免费。
分享插件调用示例,示例下载:
链接:https://pan.baidu.com/s/1lFiIPXH3mhAHUuDB3zZjfg
提取码:ib8o
自行封装通用调用方法:
<!DOCTYPE HTML>
<html>
    <head>
        <meta charset="utf-8">
        <meta name="viewport" content="width=device-width, initial-scale=1">
        <style>
            /* css 代码 可以在这里重定义部分样式 */
        </style>
		<script src="./js/6.1/highcharts.js"></script>
        <script src="./js/6.1/exporting.js"></script>
		<script src="./js/6.1/highcharts-zh_CN.js"></script>
    </head>
    <body>
        <div id="container" style="width:600px;height:600px"></div>
        <script>
            // Build the chart
			Highcharts.chart('container', {
				// 标题
				title: {
					text: '2018 年浏览器市场份额'
				},
				// 小标题/注释等
				subtitle: {
						text: '小标题' // 小标题
				},
				// 图表基础配置
				chart: {
					plotBackgroundColor: null,
					plotBorderWidth: null,
					plotShadow: false,
					type: 'pie' // 图表类型 默认:spline(走势),line(折线),column(柱状图),pie(饼图)
				},
				// 版权信息是否显示
				credits:{
					enabled:true
				},
				// 打印导出配置
				exporting:{
					enabled:true
				},
				// 图例参数
				legend: {
					//floating:true,
					backgroundColor: '#FFFFFF',
					align: 'left',
					verticalAlign: 'top',
					x: 100,
					y: 50,
					//labelFormat: '<span style="{color}">{name} (click to hide or show)</span>'
				},
				// 数据颜色分布(默认样式这里可以重定义)
				colors: ['#7CB5EC','#ED561B','#FF9655',  '#DDDF00','#50B432',
				'#F564ED','#03F2E3','#17A0FA',  '#7648FF',  '#AAAAAA'],
				//数据提示框(默认样式这里可以重定义)
				tooltip: {
					//pointFormat: '{series.name}: <b>{point.percentage:.1f}%</b>'
				},
				// 图标类型参数
				plotOptions: {
					pie: {
						allowPointSelect: true,
						//cursor: 'pointer',
						dataLabels: {
							enabled: true   // 数据标题
						},
						showInLegend: true, // 图例展示开关
					}
				},
				// y轴
				/*
				yAxis: {
					title: {
							text: '订 单 量'
					}
				},
				//x轴
				xAxis: {
					categories: [
						  '2018-06-01','2018-06-02','2018-06-03','2018-06-04','2018-06-05','2018-06-06','2018-06-07','2018-06-08','2018-06-09','2018-06-10',             ], //x轴标签名称
					gridLineWidth: 0, //设置网格宽度为1
					lineWidth: 1,  //基线宽度
					labels:{y:26}  //x轴标签位置:距X轴下方26像素
				},

				// 双Y轴
				/*
				yAxis: [{ // Primary yAxis
					allowDecimals:false, // Y轴数字不准出现小数点
					labels: {
						format: '{value} 件',
						style: {
							color: Highcharts.getOptions().colors[1]
						}
					},
					title: {
						text: '',
						style: {
							color: Highcharts.getOptions().colors[1]
						}
					}
				}, { // Secondary yAxis
					title: {
						text: '',
						style: {
							color: Highcharts.getOptions().colors[0]
						}
					},
					labels: {
						format: '{value} 元',
						style: {
							color: Highcharts.getOptions().colors[0]
						}
					},
					opposite: true
				}],
				*/

				// 数据列
				series: [
					{
						name: '占比',
						//colorByPoint: true, // pie 开启
						//innerSize: '70%', // 可以设置环形图,百分比设置环形区宽度
						data: [{ //数据
							name: 'Chrome',
							y: 51.41,
							//sliced: true, // 比例分离
							selected: true,
							color: '#7cb5ec' //重定义颜色
						}, {
							name: 'Internet Explorer',
							y: 11.84
						}, {
							name: 'Firefox',
							y: 10.85
						}, {
							name: 'Edge',
							y: 7.67
						}, {
							name: 'Safari',
							y: 4.18
						}, {
							name: 'Other',
							y: 4.05
						}, {
							name: 'Other',
							y: 2.50
						}, {
							name: 'Other',
							y: 2.50
						}, {
							name: 'Other',
							y: 2.50
						}, {
							name: 'Other',
							y: 2.50
						}]
					}/*,{ // 折线图、树状图可以多个数组
						name: '占比2',
						//colorByPoint: true,
						//innerSize: '70%',  // 可以设置环形图,百分比设置环形区宽度
						//type:'pie',		 // 可以制定图形类型,如果设置每条数据都要制定类型
						//center: [100, 80], // 如果是同时显示饼图时可以设置饼图的显示位置
						//size: 100,		 // 饼图的大小
						//showInLegend: false,	// 图例开关
						//dataLabels: {
						//	enabled: false
						//}
						data: [{ //数据
							name: 'Chrome',
							y: 50.41,
							//sliced: true, // 比例分离
							//selected: true,
							color: '#7cb5ec' //重定义颜色
						}, {
							name: 'Internet Explorer',
							y: 5.25
						}, {
							name: 'Firefox',
							y: 6.85
						}, {
							name: 'Edge',
							y: 2.11
						}, {
							name: 'Safari',
							y: 10.18
						}, {
							name: 'Other',
							y: 9.20
						}],
						tooltip: {
							valueSuffix: ' 元' // 弹层value 制定字符串
						},
						yAxis:1, // 双Y时可以制定第几个Y

						},
						*/
						/*{
							name: '降雨量',
							type: 'column',
							data: [19.9, 21.5, 16.4, 29.2, 14.0, 16.0, 15.6, 18.5, 26.4, 14.1, 15.6, 24.4],

						},*/

				],
			});
        </script>
    </body>
</html>
图例:


